Who Found the Outage First — You or Your Customer?
The vendor dashboard was green while checkout was down. The problem is not that systems fail, it is the order people find out: the customer before the vendor you pay to watch it. On why real monitoring measures symptoms, not CPU.
Por Raquel Reis
Data analyst, postgraduate in Data Science, and electrical engineer by training.
Saturday morning, a little before ten, a founder I had never spoken to reached out, referred by one of our clients and looking for a second opinion. He forwarded me a screenshot. It was not his own: it came from one of his customers, posted in a buyers’ group, showing the checkout error screen with the caption "this again?". He had asked the agency running his system how long payments had been down. Nobody could tell him. The vendor’s monitoring dashboard was all green.
What bothers me about this is not that the system went down. Systems go down; that is the nature of the thing. What bothers me is the order in which people found out: the buyer before the founder, the founder before the vendor he pays precisely to watch it.
If you outsource your engineering and you keep learning about production outages from the people who use your product, this is about the question almost no one asks before signing: when it breaks, and it will, who finds out first?
The dashboard was green. The system was not.
The vendor’s dashboard showed everything in place because it was measuring the wrong thing. CPU at 30%, memory calm, the server answering the health check every thirty seconds. None of that is a lie. It is just that none of those metrics knows whether a customer can actually complete a purchase.
The classic health check hits a route like /health and gets back an "ok". That route tends to answer "ok" even when the payment service is down, because it never touches the payment service. The server is up, passing a test it was written to pass.
Green, there, only means the process did not die. It is the lowest ceiling of health there is, and even so it is what a lot of contracts treat as good enough. When we take over a product in a Diagnostic Sprint, one of the first things I open is the list of configured alerts. I have seen a product run for two years with exactly one alert wired up: "server not responding". Nothing about errors, latency, or a stuck queue.
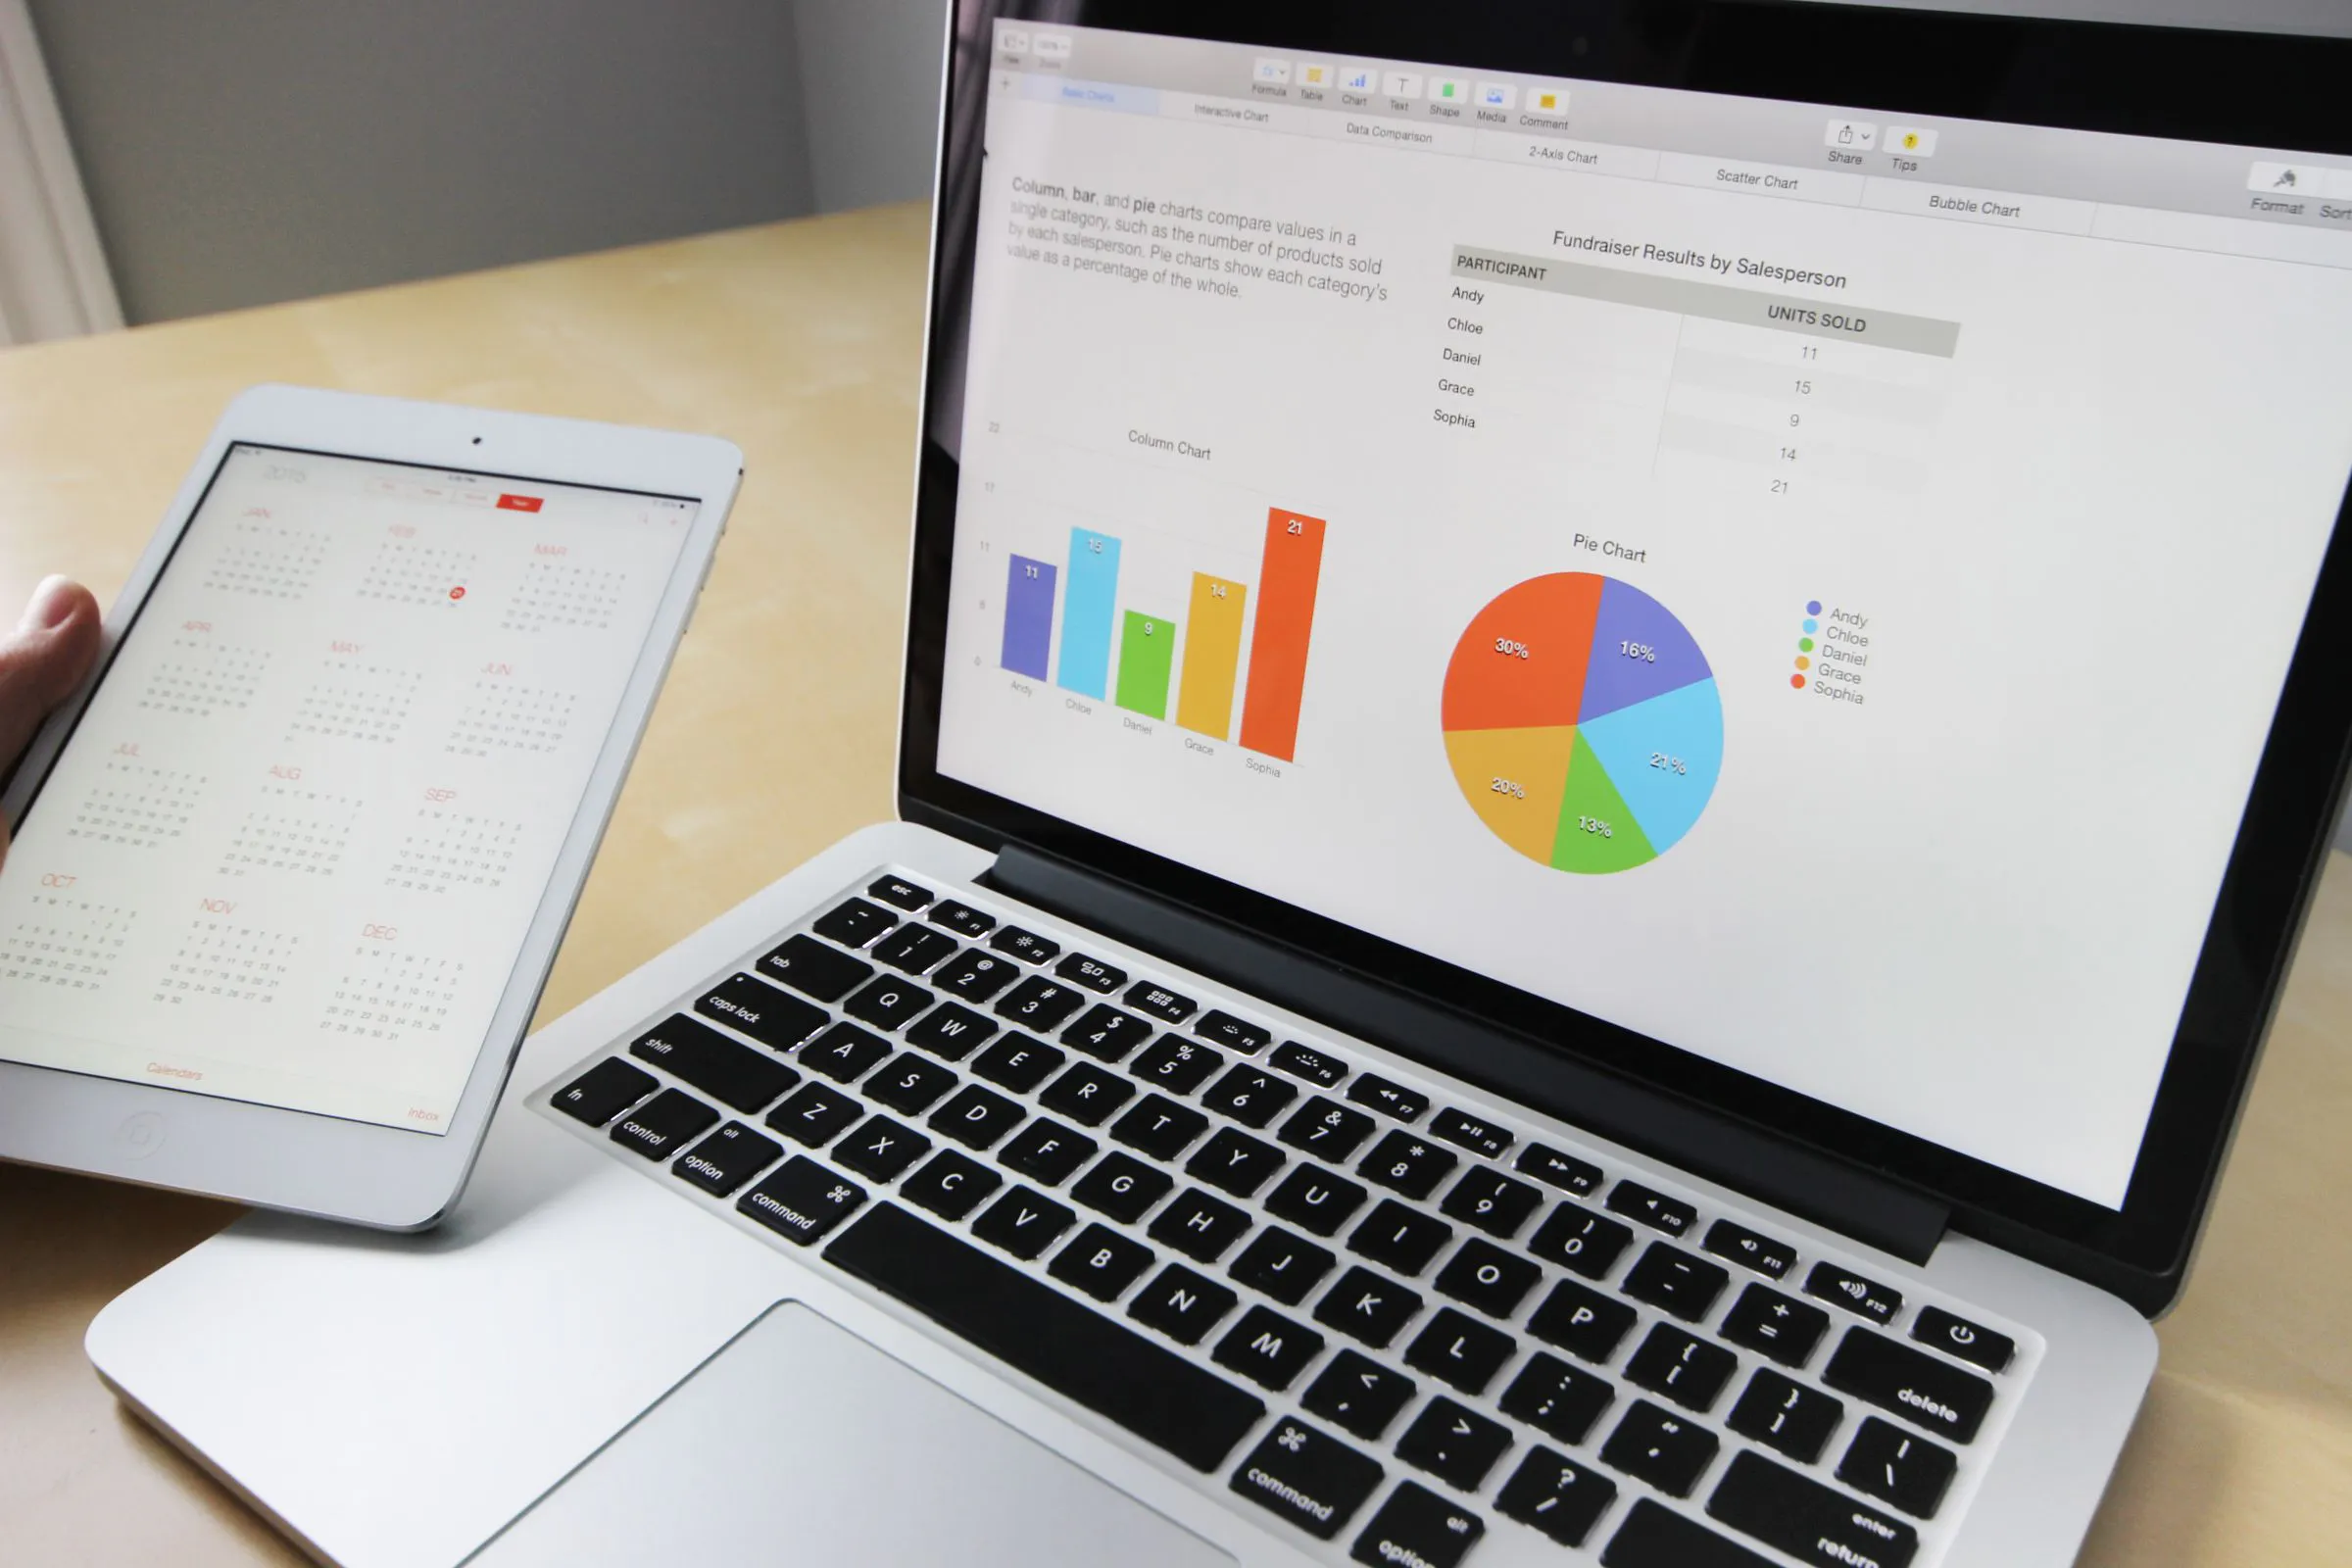
A dashboard full of colorful charts can be all green and still say nothing about whether a customer managed to check out.
What the customer feels does not fit on a CPU graph
The shift is easy to say and tedious to do: measure symptoms, not resources. Your user does not feel your CPU usage. They feel the button spin for eight seconds and come back with an error. Monitoring that earns its keep watches the experience of the person on the other side of the screen and turns that into signals that wake someone up.
In practice it comes down to a handful of alerts any team can set up in an afternoon:
- Error rate: the share of 5xx responses above a threshold (say, 2% over a five-minute window) fires an alert instead of waiting for a support ticket.
- Latency that matters: not the average, which hides everything, but p95. If the 95th percentile on checkout crosses one second, someone should know before it turns into cart abandonment.
- Synthetic check: a bot that every minute replays the real customer path (log in, add to cart, pay in a test environment) and screams when any step stalls.
- Queue and job: if order processing stops moving, the server stays green, the customer waits on a confirmation that never arrives, and no health check notices.
None of these alerts is expensive or exotic. Datadog, Grafana, or even a cron job with curl and a Slack webhook cover the basics. When it is missing, it is almost never about budget. It is that nobody stopped to think about the customer before the incident happened.
We wire up this mesh of signals in the first weeks of any project; if you want to find out what your current monitoring simply ignores, you can map that in a diagnostic before the next Saturday does the job for you.
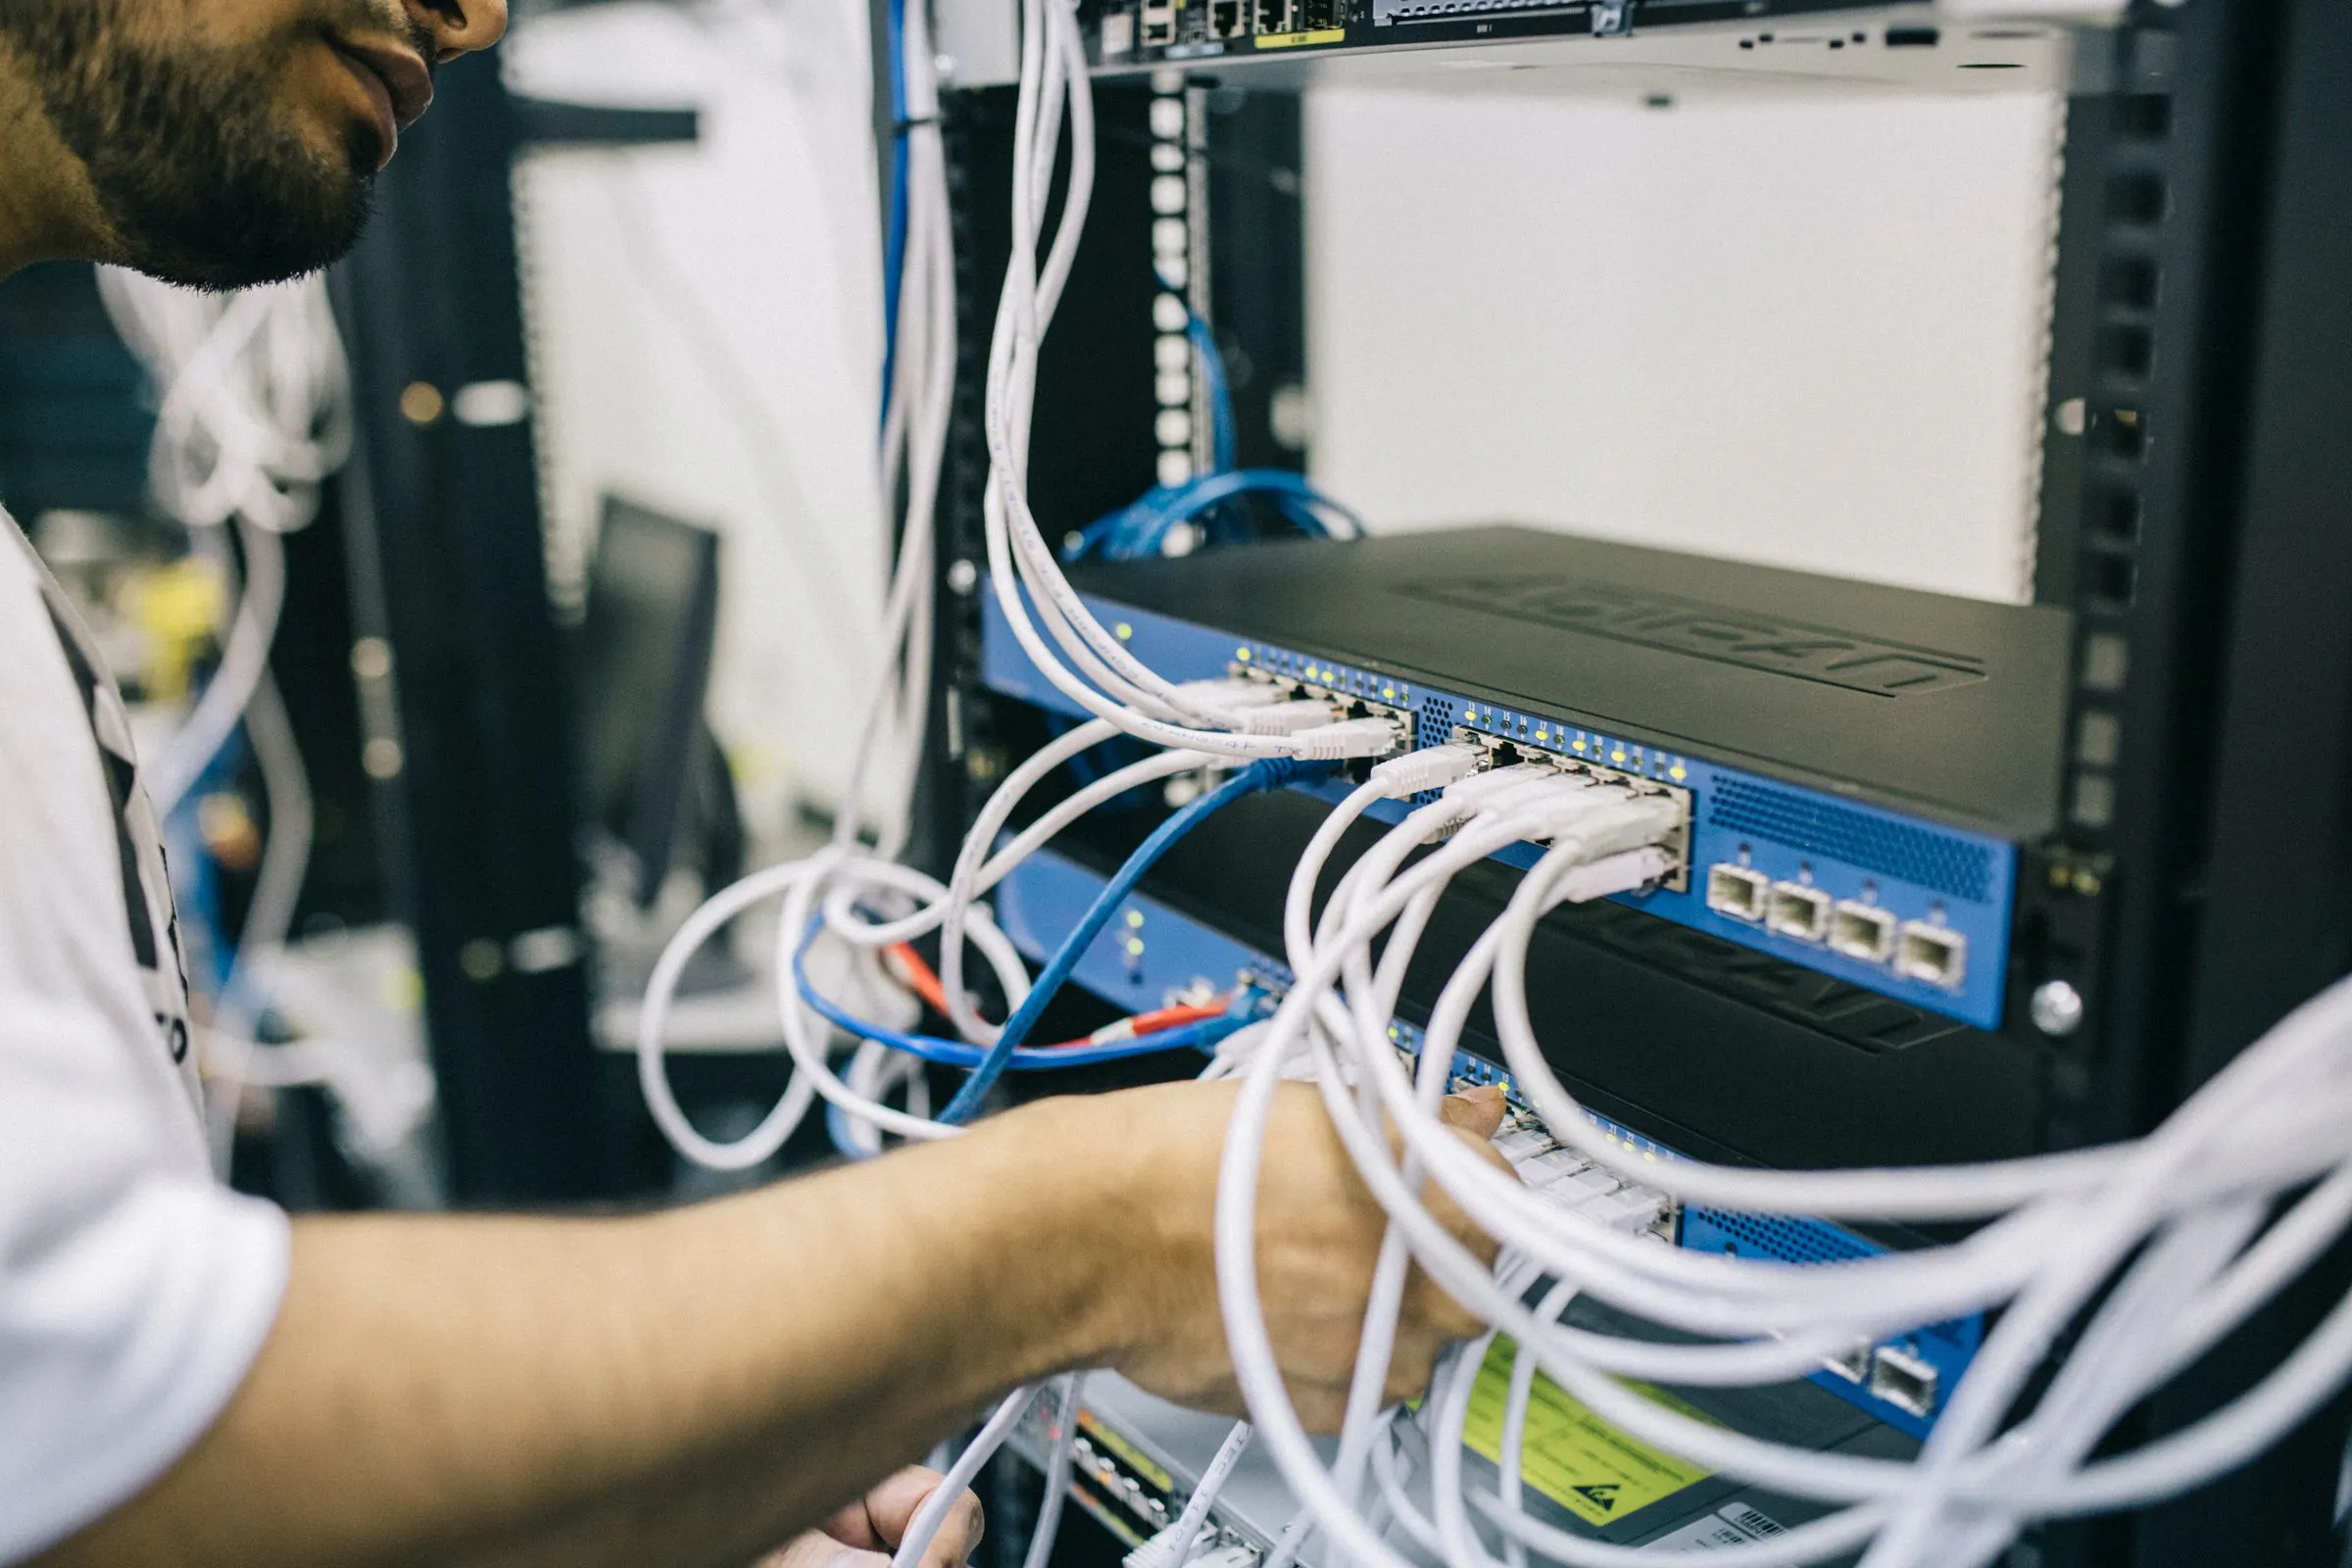
A server that is up, answering the health check every thirty seconds, has no idea the order queue stopped moving inside it.
Not every system needs a 3 a.m. on-call rotation
I have to be fair here, or this turns into scaremongering. Not every piece of software deserves round-the-clock on-call. If your product is a landing page, a five-page brochure site, or an internal tool four people use during business hours, standing up a PagerDuty rotation is swatting a fly with a sledgehammer. A plain email alert does the job and you move on.
The question that separates the two cases is blunt: if this goes down for an hour on a Sunday, does someone lose money, trust, or data? When the answer is no, relax, genuinely. When it is yes, and for almost any product that makes money it is yes, learning about the outage from your customer is not an operational footnote. It is business risk nobody priced in.
The team that stays turns on the alarm the cheap one never did
Here is the difference that never shows up in the proposal. The cheap vendor ships the requested feature and disappears. Wiring up an alert is not a screen the client drew into the scope, so it does not fit the tight budget that won the bid. The incident, when it lands, is already your problem.
At a logistics client we took on last year — lean team, six people — the first week had no new code at all. It was instrumentation: per-route error alerts, p95 on the delivery-scheduling screen, a synthetic check replaying the tracking flow every minute. The following Tuesday the synthetic fired at 6:47 a.m.; an overnight deploy had broken the tracking route. The team fixed it before the first customer opened the app.
Before that, their average time to notice an outage hovered around two hours, always through a complaint. That number came from their own account, not a dashboard, so I hold it loosely: it may be inflated by the memory of people who were furious. Even cutting it in half, an hour with the scheduling screen down during a late-afternoon peak is not cheap.
That is what a team that stays does by habit: it ships the feature already carrying the eyes that will watch it afterward. Monitoring ships in the same package as the feature, and it is part of calling the delivery done.
A few of those cases, with live product names instead of screenshots, live at revin.com.br/en/cases.
The cost of the silence
The founder from Saturday’s screenshot is still rebuilding trust with that group of buyers. The bigger loss was not the hour of checkout being down. It was the customer realizing no one on the inside was watching. That shows up on no graph, and it is the slowest thing to earn back.
Everyone asks a vendor whether they ship fast. Almost no one asks how they will know when it breaks. And it is that second answer that decides whether, next Saturday morning, the one who tells you is your monitoring or your customer.
If you have already lived one of those Saturdays and would rather skip the next, book a call with us and we will look together at what your system is not telling you today.
6 read minutes
Article content:
Ready to elevate your business
Schedule a meeting


Scraper traffic is inflating your cloud bill: how to measure it
At git.kernel.org, 14 CPU cores do nothing but render pages for scrapers, more than all legitimate access combined. How to split bots from humans in your logs first.
 Victhor Araújo
Mainframe and AI: legacy is missing logs and owners, not age
CIO Dive reports AI agents helped sustain confidence in the mainframe. Three checks that tell you whether your system is legacy, and what to do about each one.
Victhor Araújo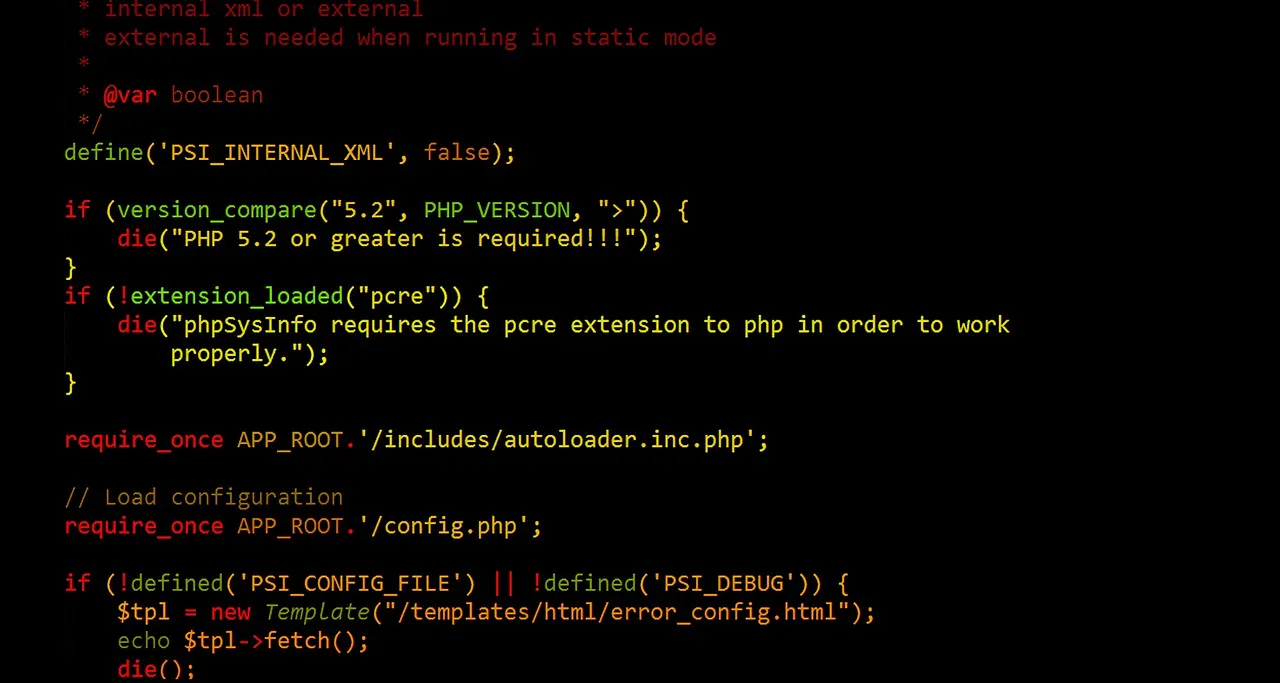
PHP 5.6 to PHP 8 or full rewrite: how to decide
Upgrading PHP 5.6 to PHP 8 usually costs less than a rewrite. Three measurements (compatibility, dead dependencies, revenue flows without tests) tell you if your case is the
Victhor Araújo
AI teams ship more code and deliver less: what to measure
PR volume is up and the product hasn't moved. Four measurements that expose where AI turns into debt: review queue, 30-day rework, mutation score and real customer use.
Victhor Araújo